Volleyball Analytics, Explained
Volleyball Code produces the same numbers national-team analysts watch — side-out %, attack efficiency, reception quality, break-point % — live from the rallies you speak. This page explains what each one means, how it is calculated, and how to read them to make decisions mid-match.
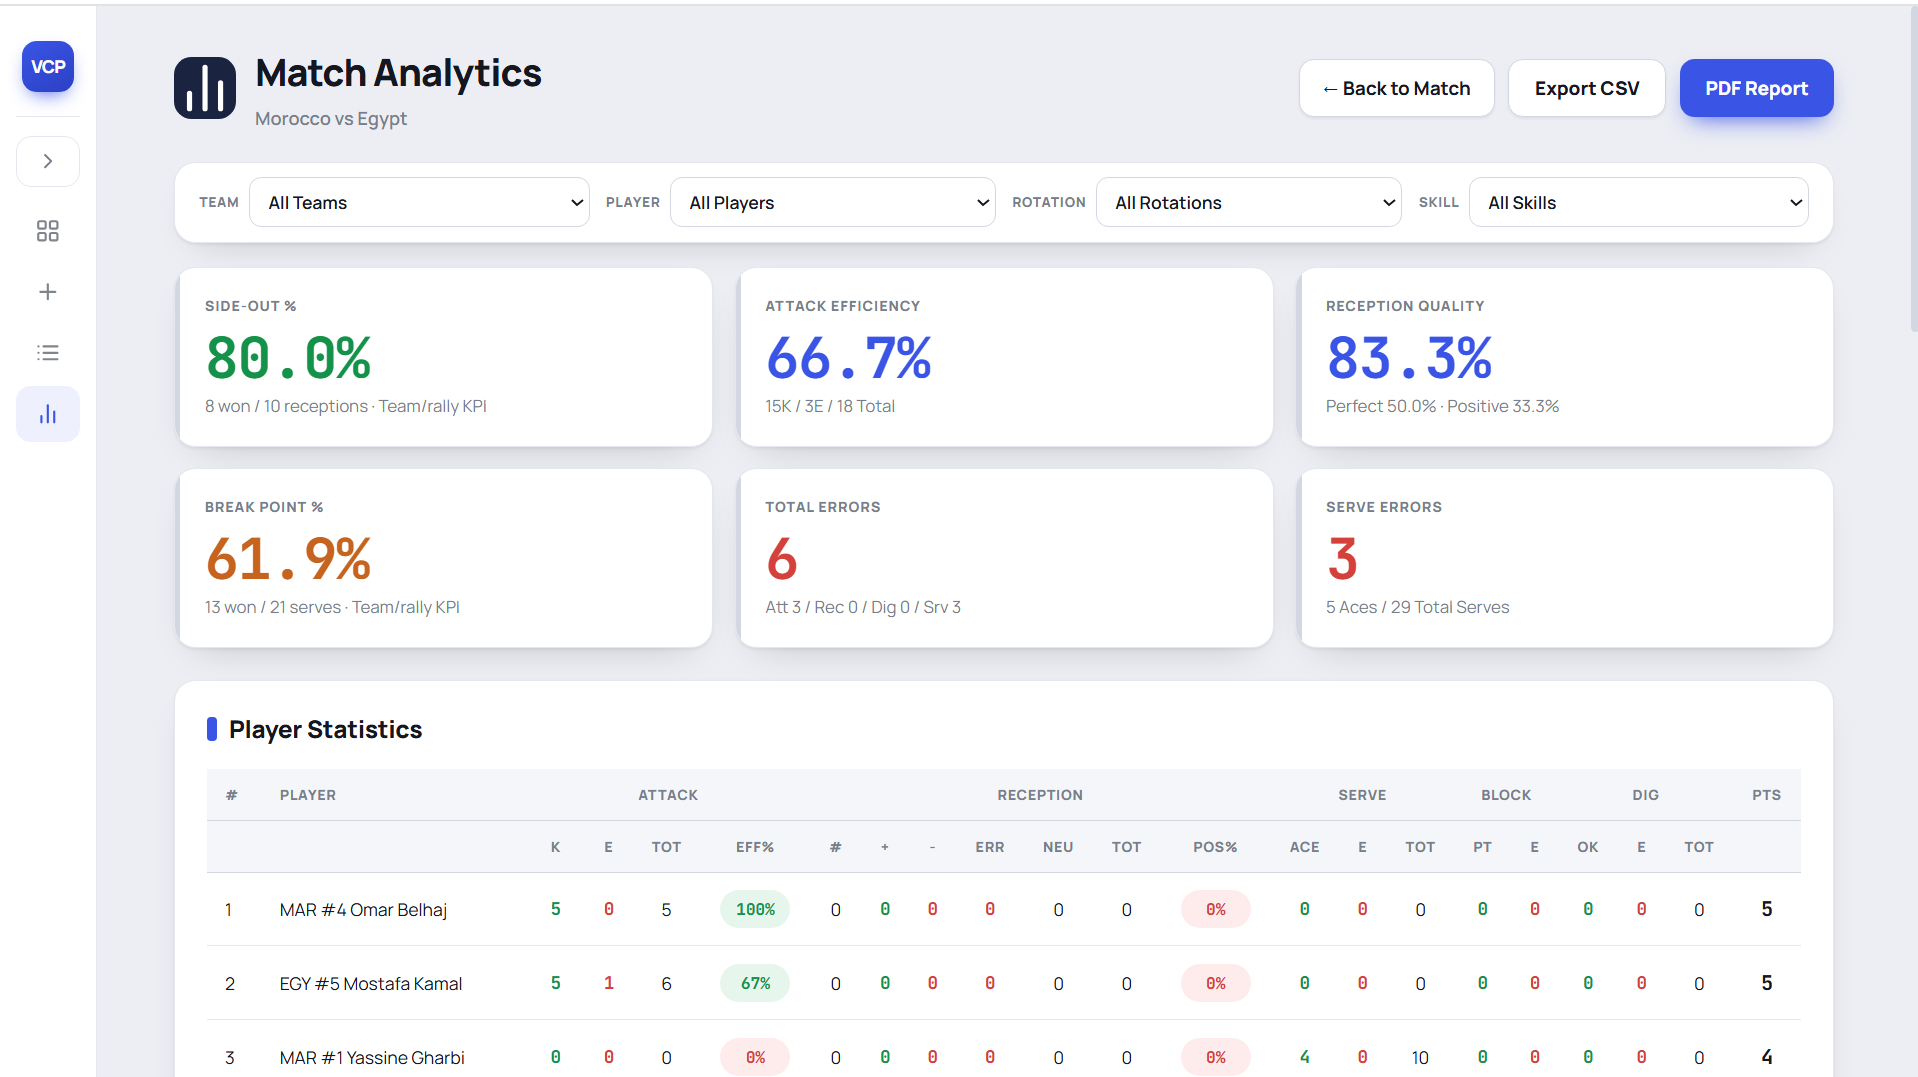
What the dashboard shows
Every card on the dashboard is computed from your coded rallies and recomputed the instant you confirm the next one — there is no separate calculate step. The four headline KPIs answer the four questions that decide most matches: are you winning your serve-receive points, are your attacks scoring, are your passes giving the setter options, and are you converting when you serve? Below the KPIs, player and rotation tables break those same answers down by person and by position.
Side-out %
Side-out percentage is the share of your serve-receive rallies that end in a point for you. It is the single most predictive number in volleyball: teams that side out well are hard to beat because the opponent has to earn every point twice.
Side-out % = points won on reception ÷ total receptions × 100Read it high and steady, and your passing and first-ball attack are healthy. Read it dropping across a set, and something upstream — reception or attack — is leaking. For the full breakdown, see the side-out percentage guide.
Attack efficiency
Attack efficiency rewards kills and punishes errors in a single number, so it is a truer picture of hitting than kill count alone. A hitter with lots of kills and just as many errors is not helping you as much as the raw total suggests.
Attack efficiency = (kills − errors) ÷ total attemptsIt runs from −1.000 to 1.000; anything above about .300 is strong at competitive level. Watch it per hitter to decide who to set in a tight set, and per rotation to spot where your offense stalls. The attack efficiency guide goes deeper.
Reception quality
Reception quality measures how good your passes are, not just whether you kept the ball alive. A perfect pass lets the setter run the whole offense; a poor one forces a predictable high ball the block is waiting for. Because it comes straight from the evaluation you call on each reception — perfect, positive, neutral, or error — it is a leading indicator: reception dips before side-out %, so it warns you a rotation is in trouble before the scoreboard does.
Break-point %
Break-point percentage is the flip side of side-out: the share of rallies you win while serving. Points on serve are the ones that build leads, since siding out only keeps you level. Strong serving pressure and a set block-and-defense show up here first.
Break-point % = points won on serve ÷ total serves × 100Player & rotation breakdown
Under the headline cards, two tables turn the KPIs into decisions. The player table lists every athlete's serving, attacking, reception, and blocking lines, so a hot hand or a struggling passer is obvious. The P1–P6 rotation matrix shows how you score and side out in each of the six rotations — the clearest way to see that, say, you bleed points in rotation 3 and should consider a serving target or a substitution when you reach it.
Match analytics vs season analytics
There are two views. Match analytics show the game you are coding right now, live. Season analytics aggregate every completed match into trends — per player and per rotation across a whole competition — so you can see a passer improving or a rotation that has been costing you points all season. Same numbers, different time horizon.
Exporting your numbers
When the match ends, export the full dataset to CSV to feed your own models, or generate a PDF report — team stats, player breakdown, and P1–P6 rotation analysis — to share with players and staff within minutes. Nothing has to be copied by hand.
Frequently asked questions
How often do the analytics update?
Every card recomputes the instant you confirm a rally. There is no separate calculate step — the moment a point is scored, side-out %, attack efficiency, and every other number reflect it.
What is a good side-out percentage?
At competitive club and school level, roughly 60% is average and 65% or higher is strong. Elite international teams push past 70%. The most useful comparison, though, is your own team over time and across rotations.
Can I see analytics for a single player or one rotation?
Yes. Every card is filterable by team, player, rotation, and skill, and there are dedicated player and P1–P6 rotation tables so you can isolate exactly where points are won and lost.
What is the difference between match and season analytics?
Match analytics show the numbers for the game you are coding right now. Season analytics aggregate every completed match into trends per player and rotation, so you can track progress across a competition.
See these numbers on your own team
Code a match by voice and watch side-out %, attack efficiency, and reception quality build in real time. Start free, no card.
Start free →Related: What is stat tracking? · Side-out percentage · Attack efficiency · How to track volleyball stats · All features